
Manage your network and cybersecurity at a glance.
The Wanup dashboard gives you a clear, concise, real-time view of the status of your network infrastructure. Designed for CIOs, CISOs and IT administrators, it puts all your connections, devices and traffic under control in just a few seconds.
Instant overview.

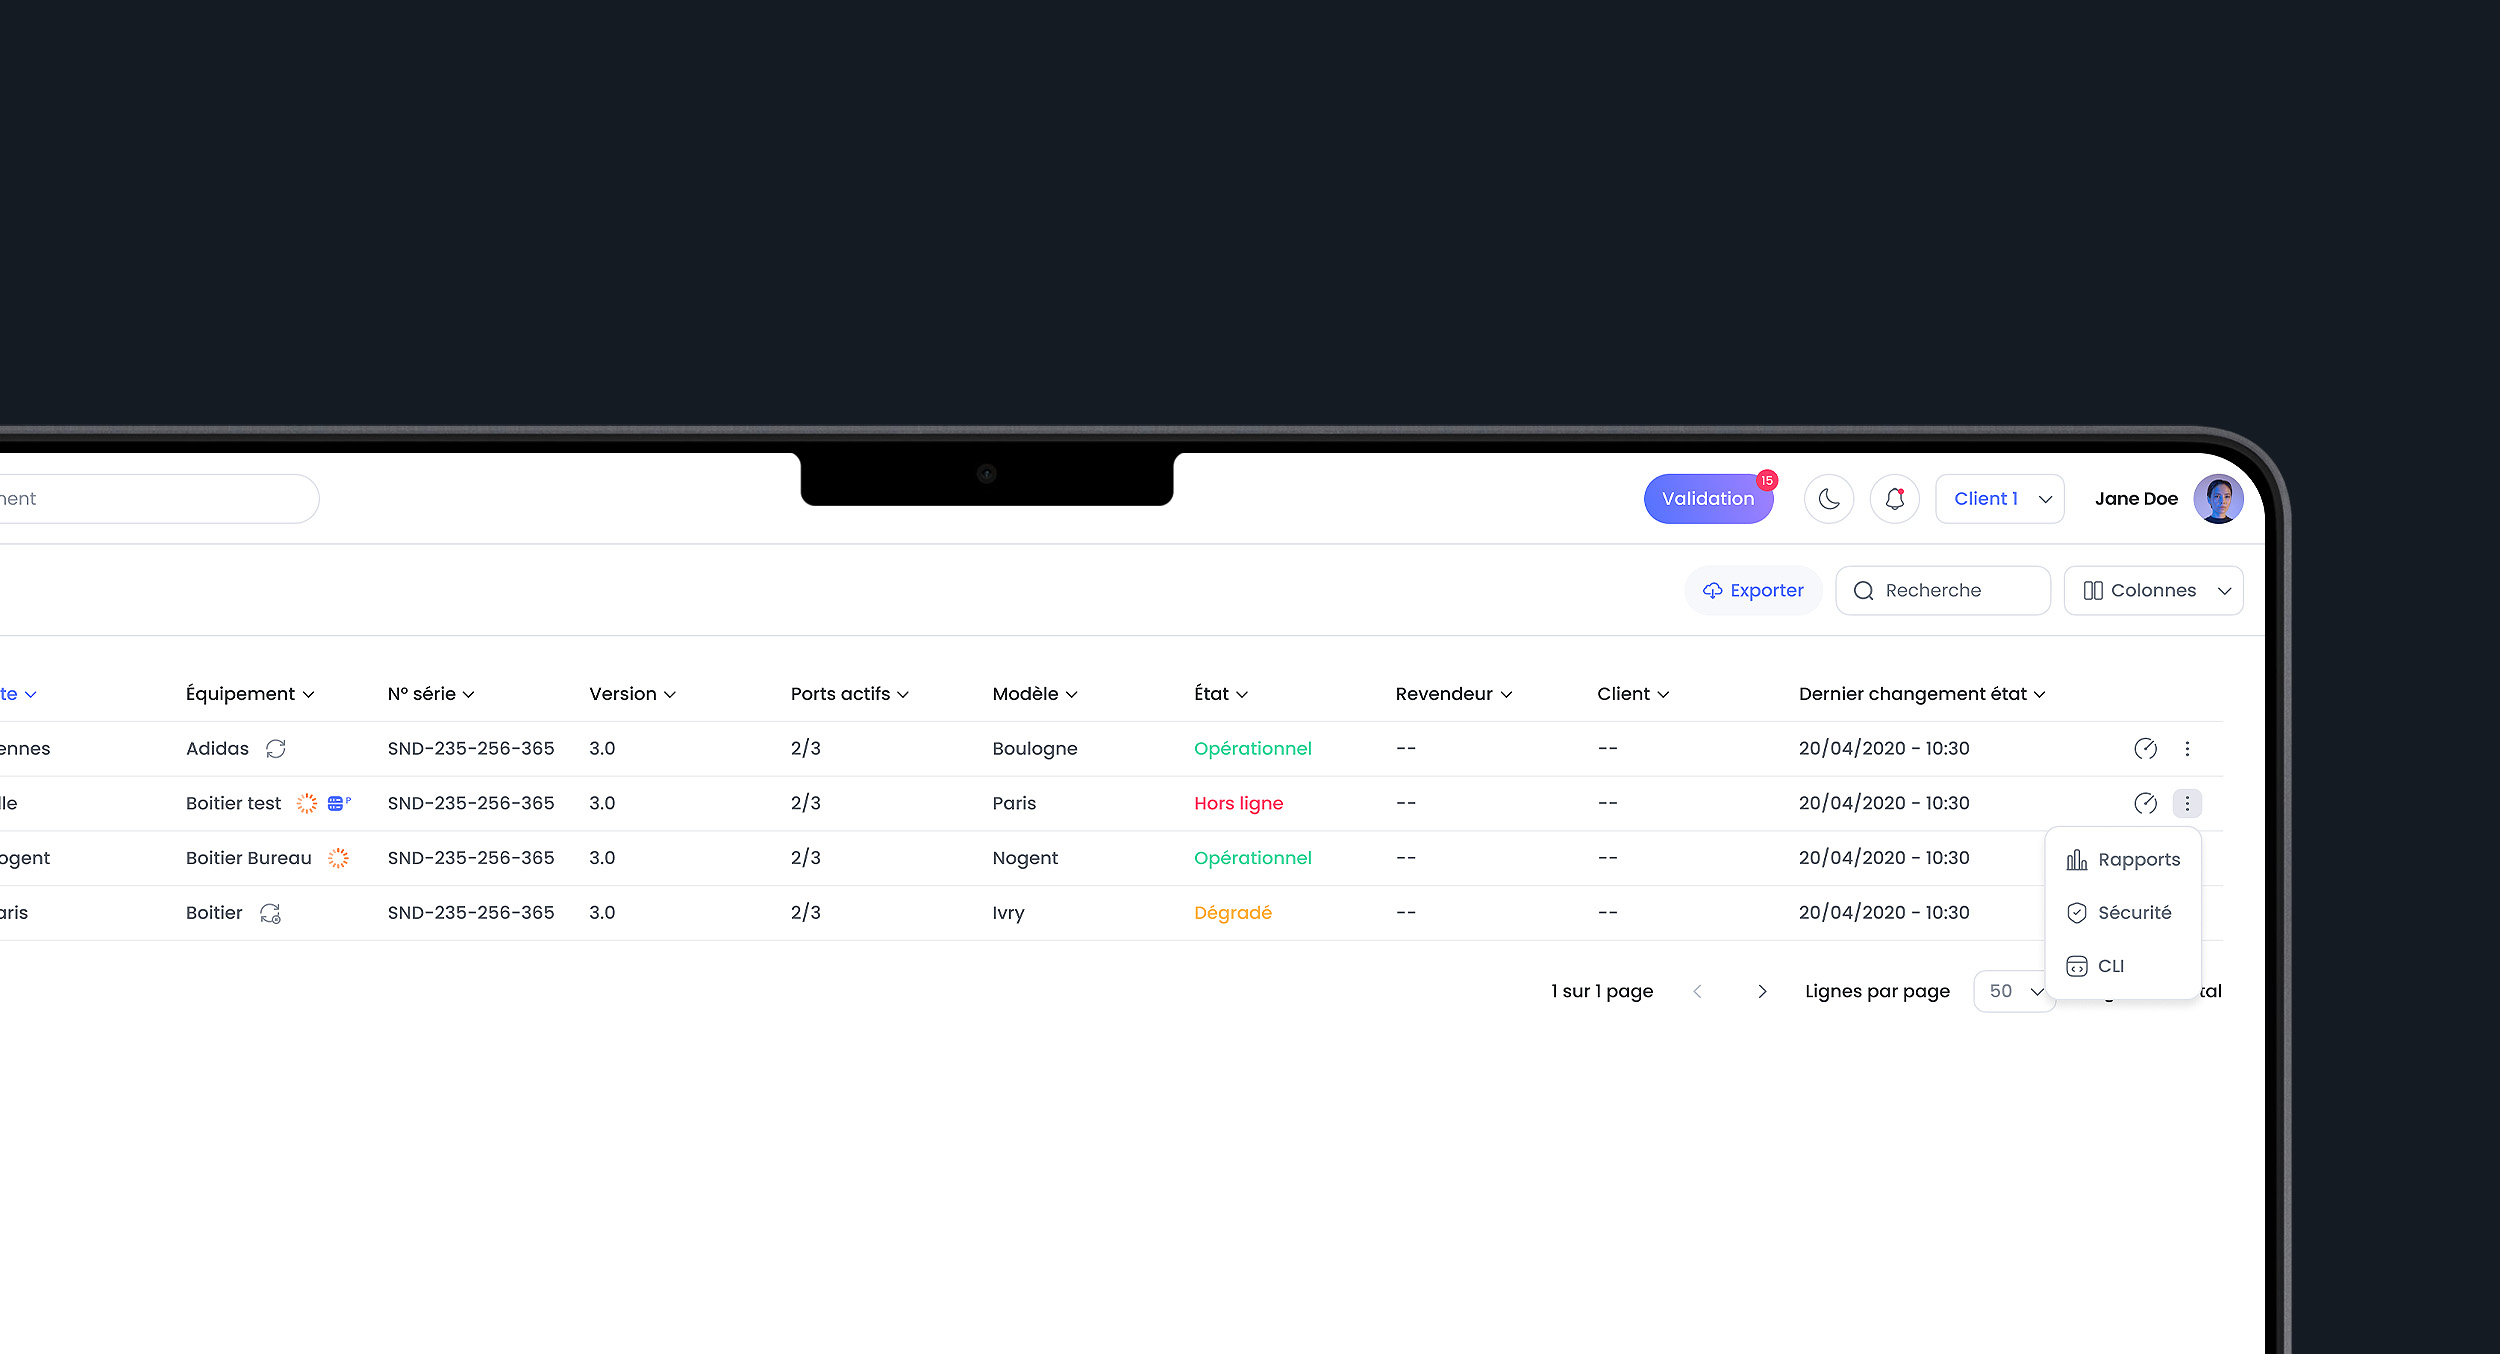

Network and traffic statistics
View them in real time or over custom periods (day, week, month).
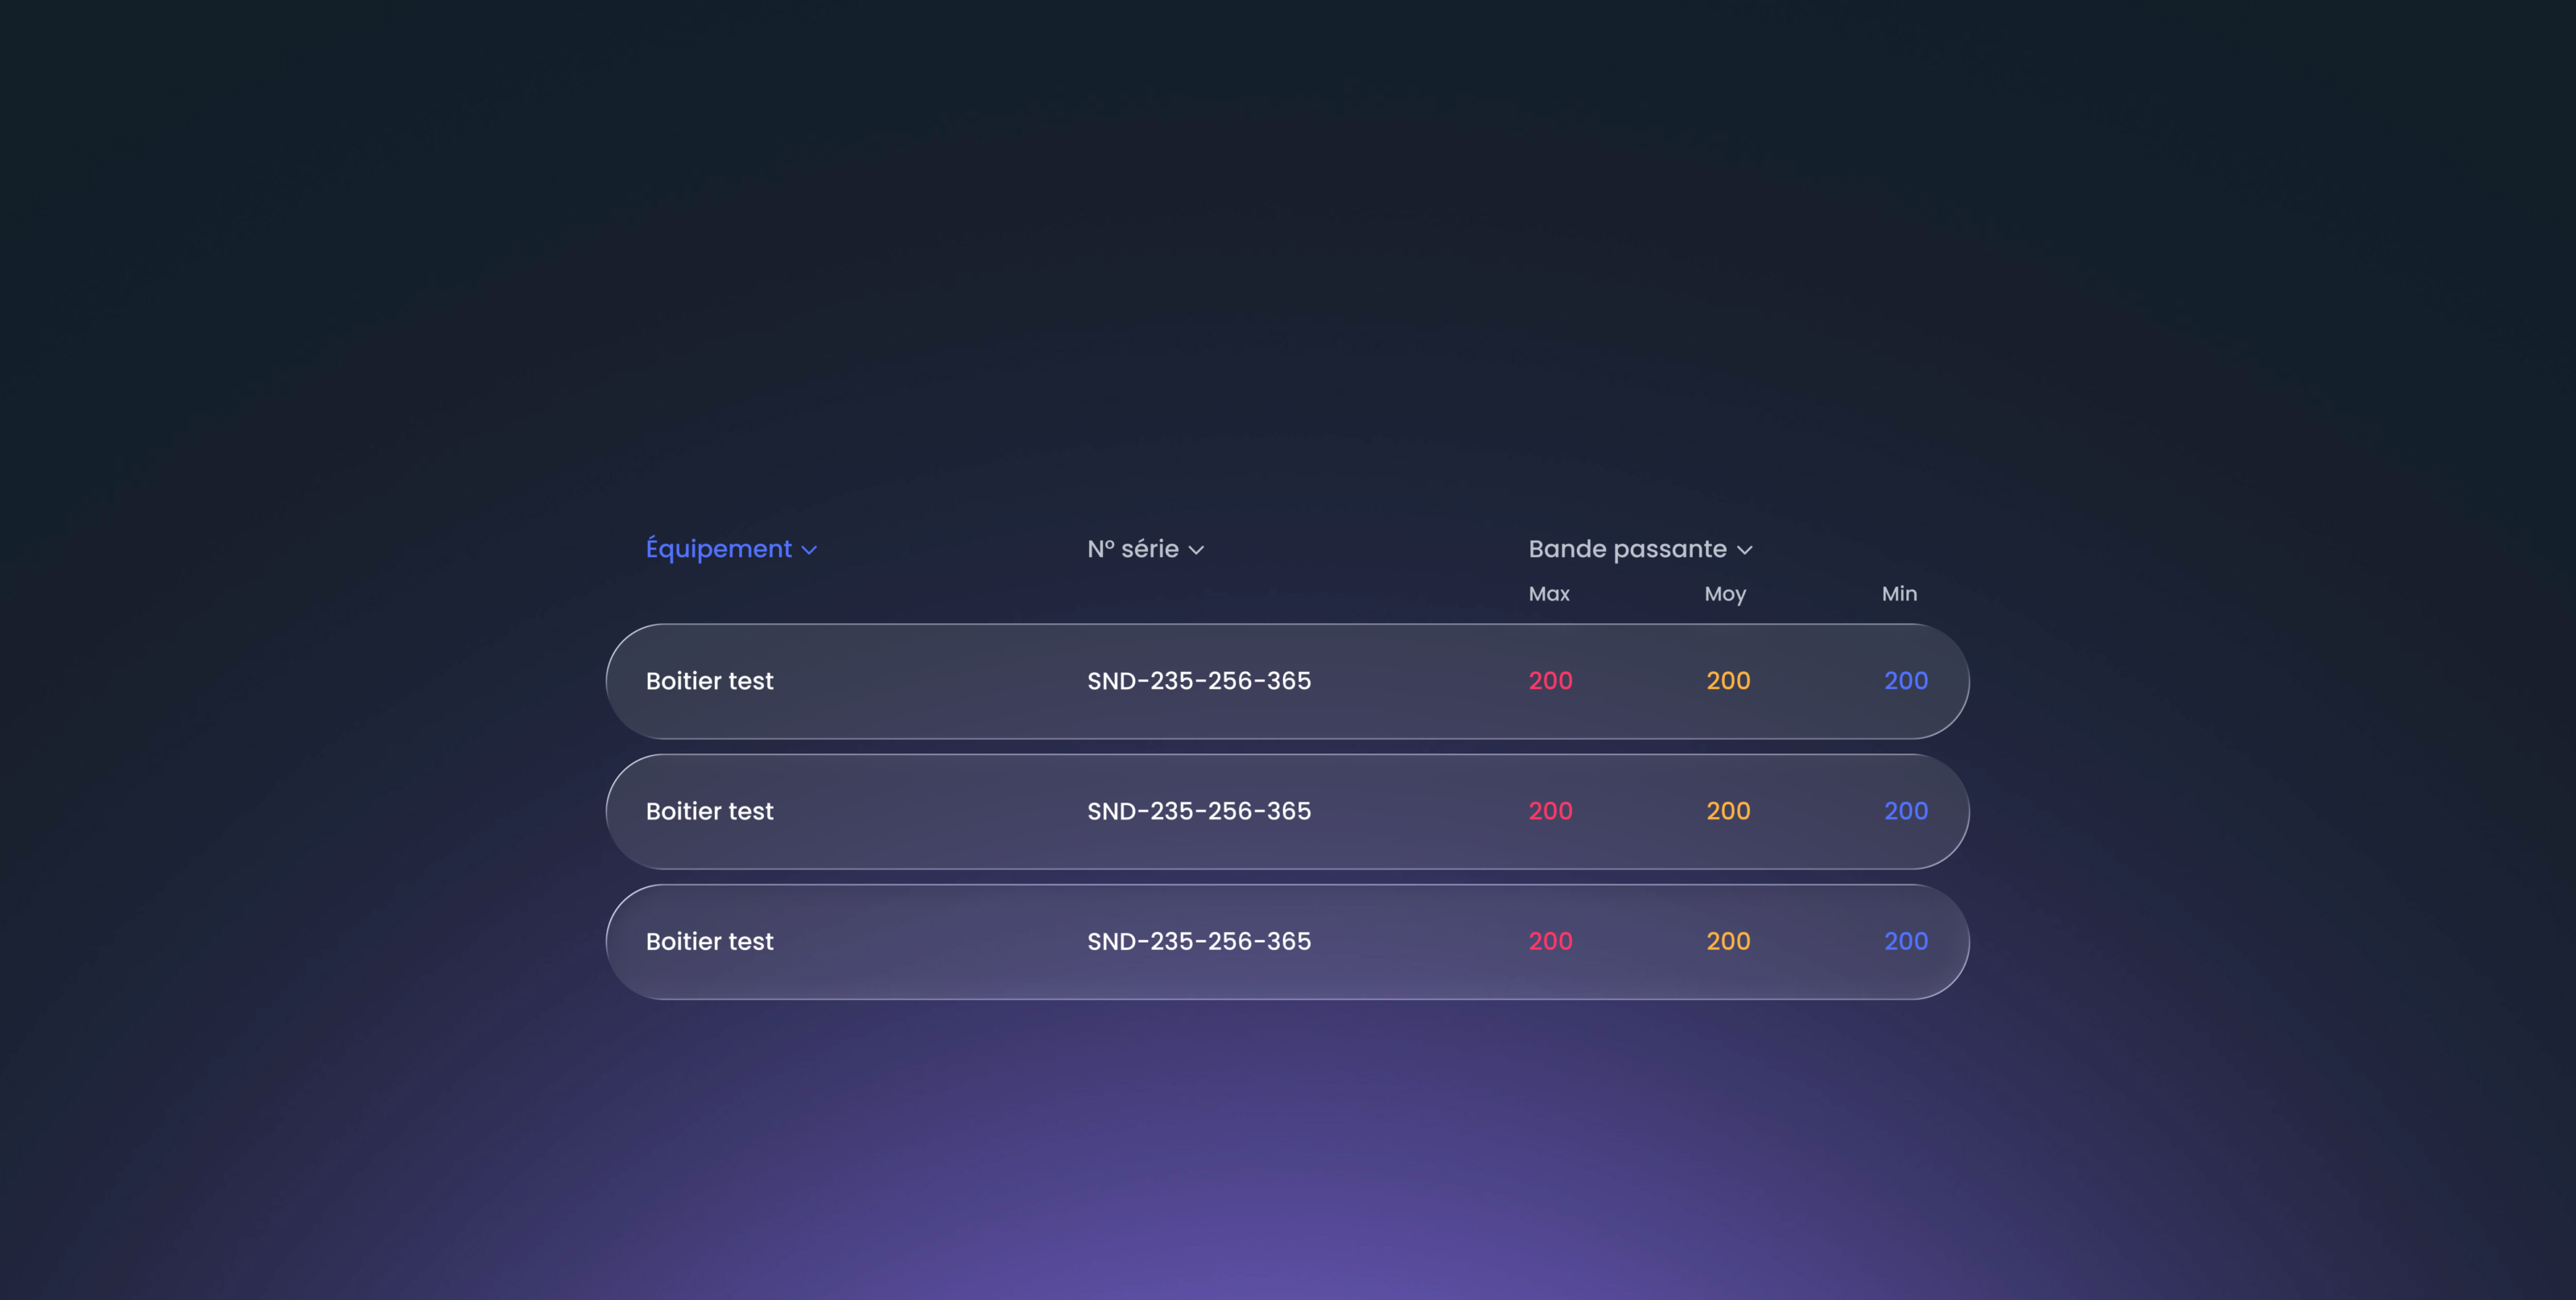

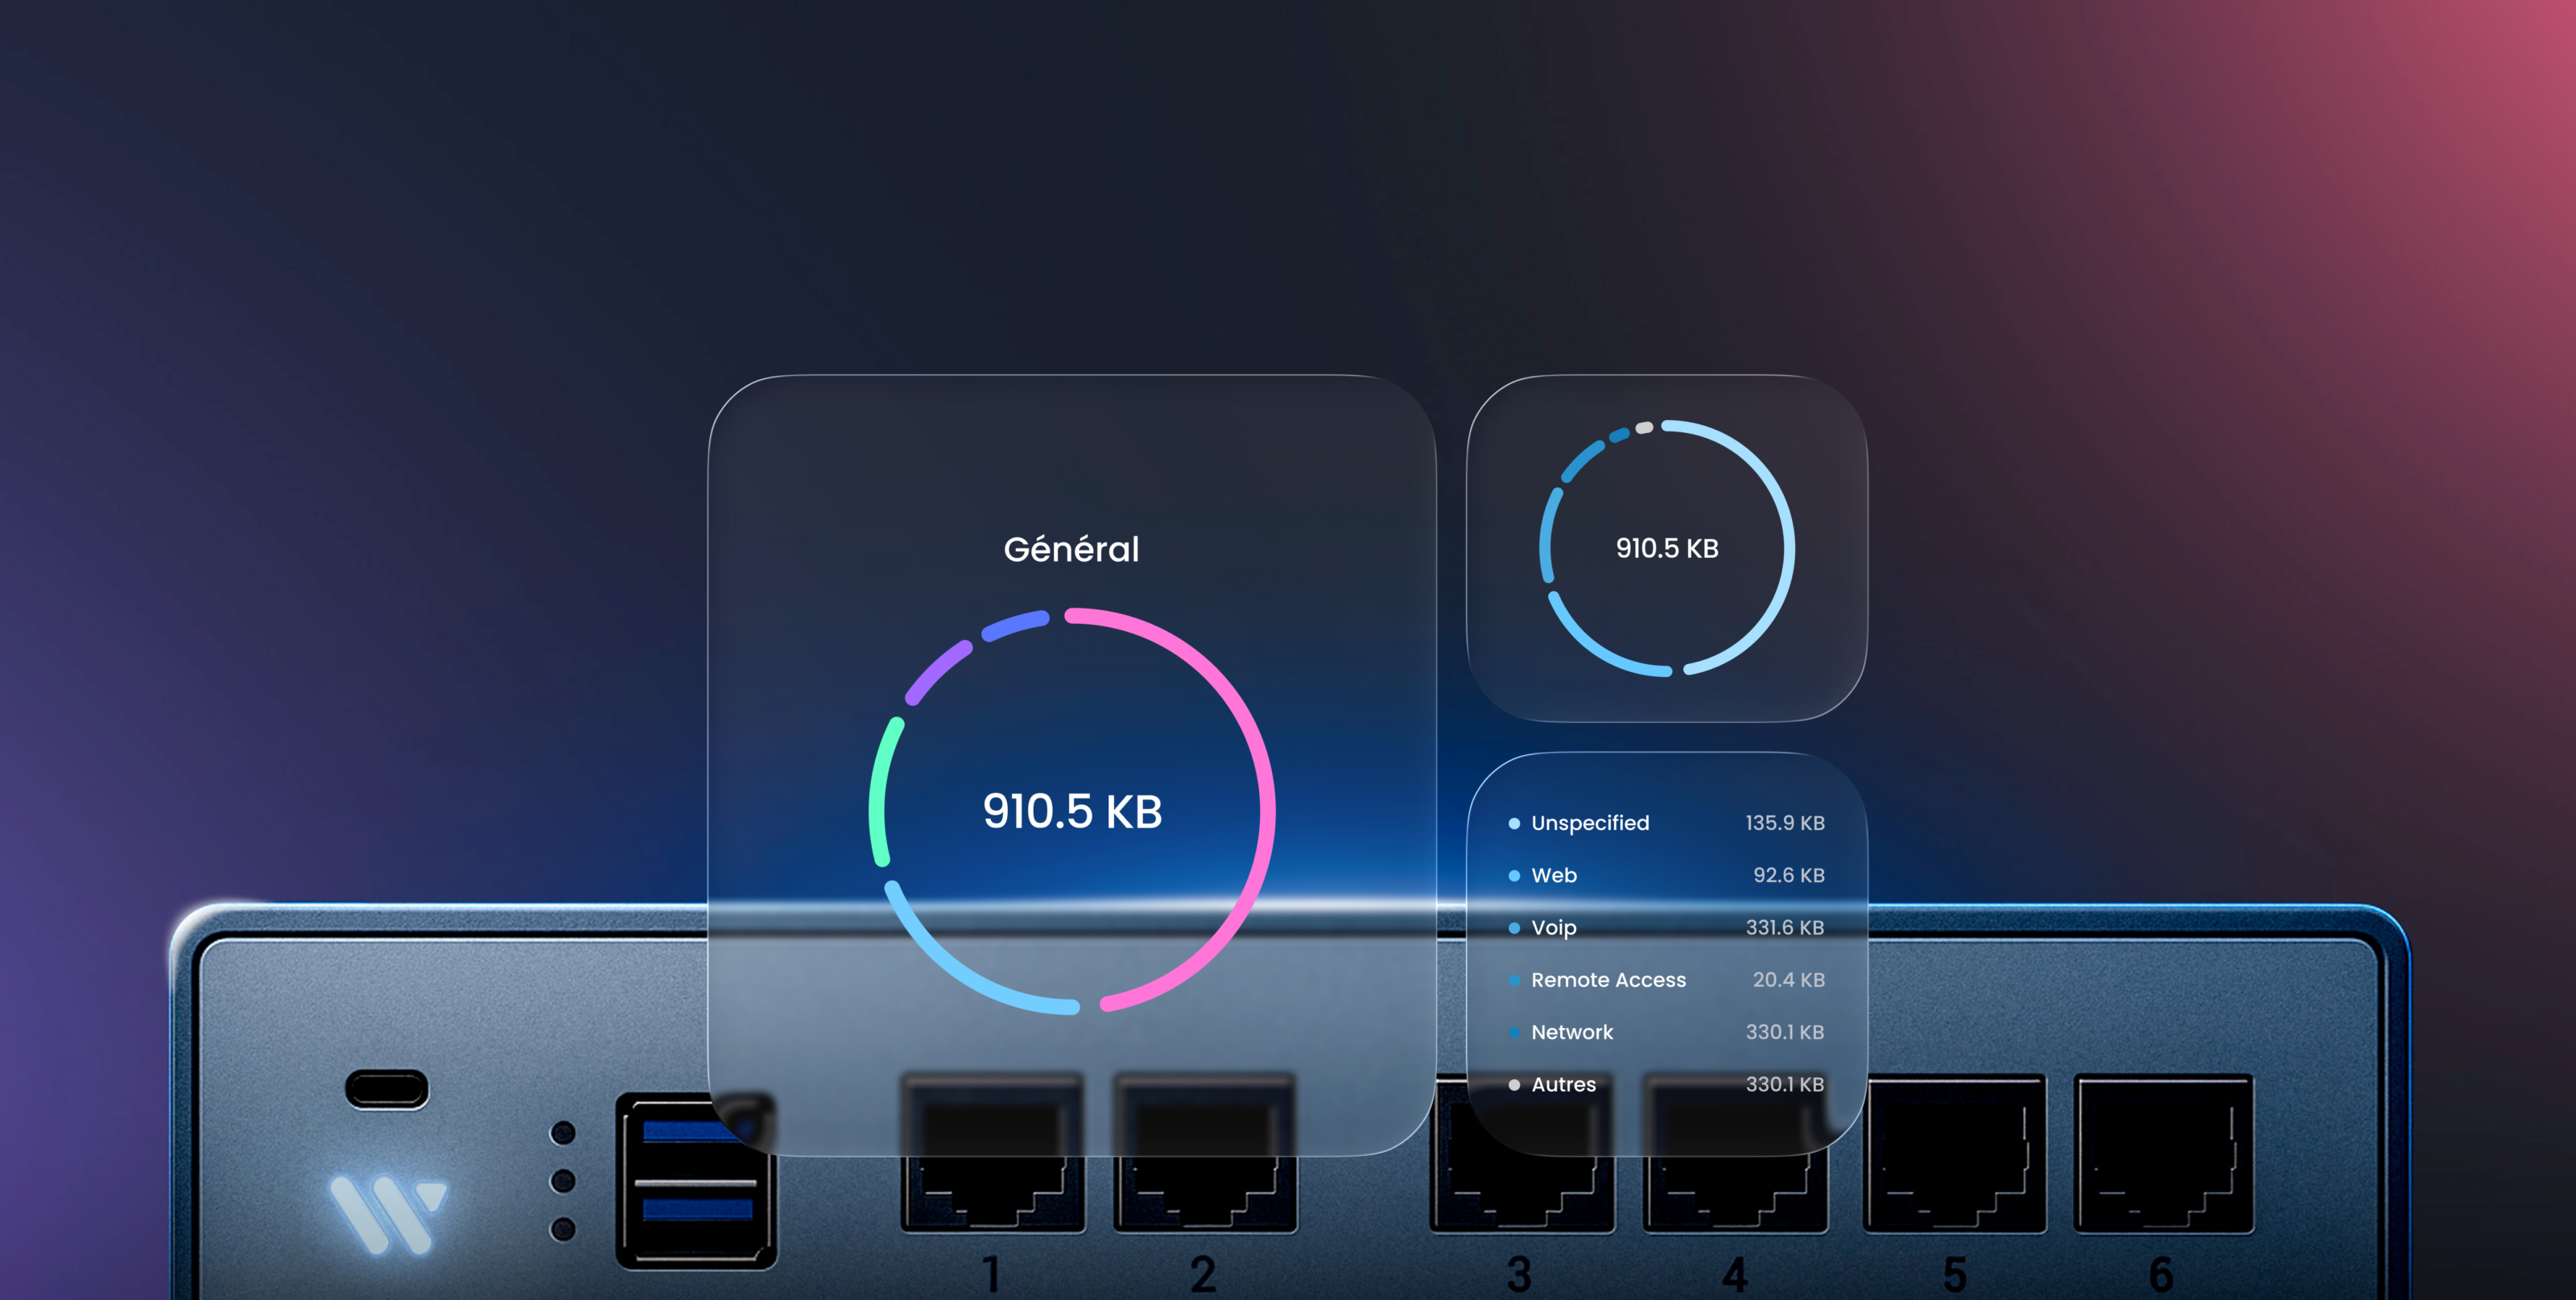
Centralised network & cybersecurity monitoring.
The Wanup dashboard centralises key data to give you unified monitoring, combining network performance and security indicators. The goal: act fast, detect early, optimise continuously.
Customer case studies
Discover how our solution
is implemented in the field.